

Measure App Performance By Using Macrobenchmark

By Sahil G — “Android Ninja”

Want to measure and improve the app loading time when the user launches the app the first time but doesn’t know where to start? or have you optimized the performance and wondered if there’s space for improvement
Then you can benchmark your app…
In this article, we will take a look at how to measure the app performance by using Jetpack Macrobenchmark Library and improve it by approx. 30% by using the Baseline profile Library.
This is to understand what is happening in an app and ensure it meets your expectations.
We have several tools to inspect the app’s performance but when getting started it’s recommended by Google to focus on only one area at a time.
These areas can include:
For manual inspection, we can use multiple tools like system tracing which is one of them. In this blog, we will not be covering this topic. For more details visit this link.
https://developer.android.com/topic/performance/tracing
In this, we write test cases that we can run to collect and aggregate performance data. This helps you understand what users are actually seeing and identify when regressions may occur. To set up automated test cases we need to use benchmarks. Let’s move to the next step using macrobenchmark.
Macrobenchmark is a jetpack library that provides us with an automated way to inspect performance by running tests and covers cases like app startup time, UI manipulation(i.e. Scrolling Events), Cross-Activity navigation, and animations. The library provides the performance results in the Android studio itself and generates the reports in JSON files as well.
With Jetpack Macrobenchmark you can:
Instrumentation using this library doesn’t call your application code directly but instead navigates your application as a user would — touching, clicking, swiping, etc. The measurement happens on the device during these interactions. If you want to measure parts of your application code directly, see Jetpack Microbenchmark instead.
Writing a benchmark is like writing an instrumented test, except you don’t need to verify the state your app is in. The benchmarks use the JUnit syntax (@RunWith, @Rule, @Test, etc.), but the tests run in a separate process to allow restarting or pre-compiling of your app. This allows us to run your app without interfering with its internal states, just as a user would. We do this by using UiAutomator to interact with the target application.
Enough theory…Let’s get started on the coding part!!
Add a benchmark module to an existing project by following the steps otherwise, create a new project first.
The recommendation is to use the latest version of the android studio as these are new features in that version of the IDE that integrate with Macrobenchmark.
To create a new module, do the following:


Minimum SDK — at least Android 6 (API level 23) or newer is required
2. Also in the app gradle file the new build type is added by name of the benchmark.
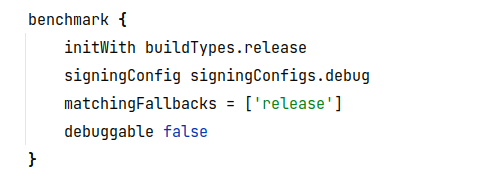
InitWith — This is to keep our macrobenchmark module as close as possible to release build type so it provides us the accurate performance result
Signing Config — We are using the debug signing config so we don’t need to add the release keystore.
Matching Fallbacks — This is to specify the app gradle should try to use if the same matching build type is not present in the module gradle(or dependent module). For more info visit this link
https://developer.android.com/build/build-variants
Debuggable — This flag should be false for macrobenchmark otherwise it adds a lot of performance overhead and makes the result inaccurate.
3. As the debuggable option is false it adds the profilable tag in the manifest which allows the benchmark to profile your app with release performance.
In this, we require a minimum API level of 29 and prior to profilable we only profile the debuggable app which leads to performance overhead. For more detail
https://developer.android.com/studio/profile#profileable-apps

AppStartup time or the time taken by the app to load and become usable for the users. In macrobenchmark module creates a test class by the name ExampleStartupBenchmark which provides us with the metric of app startup time taken by the app.

When writing a benchmark, your entry point is the measureRepeated function of the MacrobenchmarkRule. This function takes care of everything for your benchmarks, but you need to specify these parameters:
packageName – Benchmarks run in a separate process from the app under test, so you need to specify which application to measure.metrics – What type of information do you want to measure during the benchmark In our case, we're interested in app startup timing. Check documentation for other types of metrics.iterations – How many times the benchmark will repeat. More iterations mean more stable results, but at the cost of longer execution time. The ideal number will depend on how noisy this particular metric is for your app.startupMode – Allows you to define how your application should be started upon the start of your benchmark. Available are COLD, WARM and HOT. We use COLD, as that represents the biggest amount of work the app has to do.measureBlock (the last lambda parameter) – In this function, you define the actions you want to measure during the benchmark (starting an Activity, clicking on UI elements, scrolling, swiping, etc.) and macrobenchmark will collect the defined metrics during this block.Macrobenchmark will reinstall and restart your app. Macrobenchmark provides several useful functions and parameters to interact with your app.
StartActivityAndWait() — This is the main function that starts your default activity and waits until it renders the first frame before continuing with the instructions in your benchmark.
pressHome() — This allows you to reset the benchmark to a base condition in cases where you don’t kill your app in each iteration (for example. when you use StartupMode.HOT).
To run the test case first follow the below steps:
1. Go to the build variants (Generally at the bottom left).
2. Select the active variant of the app to benchmark
3. Wait for gradle sync

Now run the benchmark test by clicking on the run button as shown in the screenshot

Make sure you are testing it on the physical device because running it on an emulator means measuring your host machine’s performance if that is under heavy load, your benchmarks will perform slower and vice versa and it will fail at runtime with a warning that it will give incorrect results.
Once you run the benchmark, your app will be rebuilt and then it will run your benchmarks. The benchmarks will start, stop and even reinstall your app several times based on the iterations you defined.
If you have a physical device then you can skip this step otherwise to run it on the emulator we need to follow the below steps.
There are two ways to run it on the emulator


2. From the opened window, select the “options” icon next to “Instrumentation arguments”

3. Add the Instrumentation extra param by clicking ➕ and typing the details

4. Confirm the choice by clicking OK. You should see the argument in the “Instrumentation arguments” row

5. Click Apply and now run that configuration.

Run the test case on Samsung Galaxy M30 and get the minimum value of 366.7ms, a median was 395.8ms and max was 641.6ms.
Note — Every time you will get different results even after running the same benchmark on the same device results depends upon the following factors:
Because of that, it’s important to compare results on the same device, ideally being in the same state, otherwise, you can see great differences. If you can’t guarantee the same state, you may want to increase the number of iterations to properly deal with the result outliers.
In the previous test we got the result only for the initial time taken by the app to load but when you also want to identify the time taken to draw the first frame and become usable for the users(This is called time to full display tfd) then we need to add an extra line of code.

Add Activity.reportFullyDrawn() function to lifecycle methods of your activity or fragment when we are expecting that UI is fully visible to the user like in onCreate /onViewCreated() then run the benchmark test again.

The Macrobenchmark library automatically collects the timing taken by the first frame to be fully drawn.
For more info
https://developer.android.com/codelabs/android-macrobenchmark-inspect#8.
Previously we used startupTimingMetric which we could use to detect the app’s initial loading time and now if we want to identify any drops in frames by the app or in simple terms how smooth the app is.. in that case, we can use FrameTimingMetric.
Example — Let’s say you only want to identify the frames drops while scrolling the recycler view before you don’t want to measure anything then we need to add that code in setupBlock and the code whose performance you want to measure put that in measured Block.

In this test case, we are checking that the recycler view having id rvList is inflated and after that, we are setting the gesture margin because the app could trigger the system navigation and leave your app instead of scrolling the content.
Now run the test case and now you will get the results as in Snapshot

Frame Duration CPU MS — It means how much time the frame took to be produced on the CPU — on both the UI Thread and RenderThread.
Frame Overrun Ms — How much time a given frame missed its deadline by. Positive numbers indicate a dropped frame and visible jank/stutter, negative numbers indicate how much faster than the deadline a frame was. Available only on Android 12 (API level 31) and higher.
The results are in percentile and which means that the median value(P50 the 50%of frames) loads in 6.3 ms which is 10.7 ms under the frame time limit and if the frame overrun value is positive then we need to check the systrace to identify where the problem is on clicking on iterations(0,1,2,3 etc) because there may some frames skipped which will be noticeable to the user.
We can use other metrics based on our requirements please go through the below link for more info
https://developer.android.com/topic/performance/benchmarking/macrobenchmark-metrics
In the upcoming blog, we will learn about how to improve app performance by using baseline profiles.
In this blog, we learned about performance inspection in two ways manual and automation. For automation, we are using macrobenchmark and to make it automated for analyzing the performance we are writing test cases in which we can use multiple metrics based on requirements and gets the results accordingly.
Hope this blog will help you to learn the automated way to analyze the performance which we improve by using baseline profile which helps us to make the app smoother.
I hope you enjoyed this tutorial. If you have any questions or feedback, please feel free to share in the comments.
We at CaratLane are solving some of the most intriguing challenges to make our mark in the relatively uncharted omnichannel jewellery industry. If you are interested in tackling such obstacles, feel free to drop your updated resume/CV to careers@caratlane.com!


Leave a Reply